Saad Ullah

⬤ The current AI-driven stock rally has already run longer than most major market bubbles from the past century. Data from Bank of America strategist Michael Hartnett shows that ten significant equity bubbles since 1900 lasted about two and a half years on average, delivering typical gains of 244% from bottom to top.
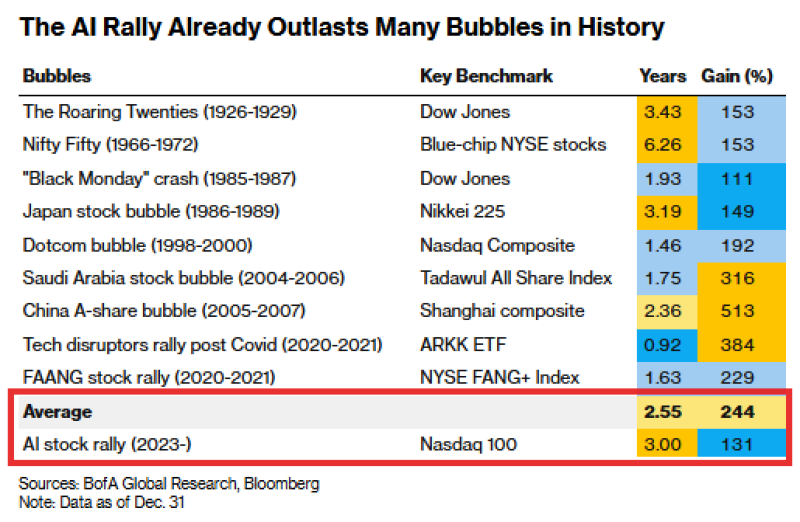
⬤ Looking at the comparison chart, past bubbles like the Roaring Twenties, the dot-com boom, Japan's 1980s stock surge, and the 2020-2021 FAANG rally all peaked in under three years. The AI rally, measured through the Nasdaq 100, has now hit roughly three years—pushing past that historical average timeframe.
⬤ The numbers tell an interesting story. Since late 2022, the S&P 500 is up about 79%, while the Nasdaq 100 has jumped around 130%. These are solid gains, but they're still well short of that 244% average from previous bubbles. As Hartnett's analysis suggests, "the AI rally has been more extended in time, even if cumulative gains have not yet matched prior extremes."
⬤ What makes this significant is how it frames where we are right now. The fact that this rally has already outlasted most historical bubbles hints at something structurally different rather than just another classic boom-bust replay. Still, with current gains trailing the historical average, investors are closely watching whether this extended cycle will eventually catch up to those past extremes or follow its own unique path.
 Saad Ullah