Usman Salis

⬤ Artificial intelligence is starting to show up in real employment numbers. The chart from 3Fourteen Research follows monthly payroll data from 2014 through early 2026 and shows a structural split that's been widening over the past few years.
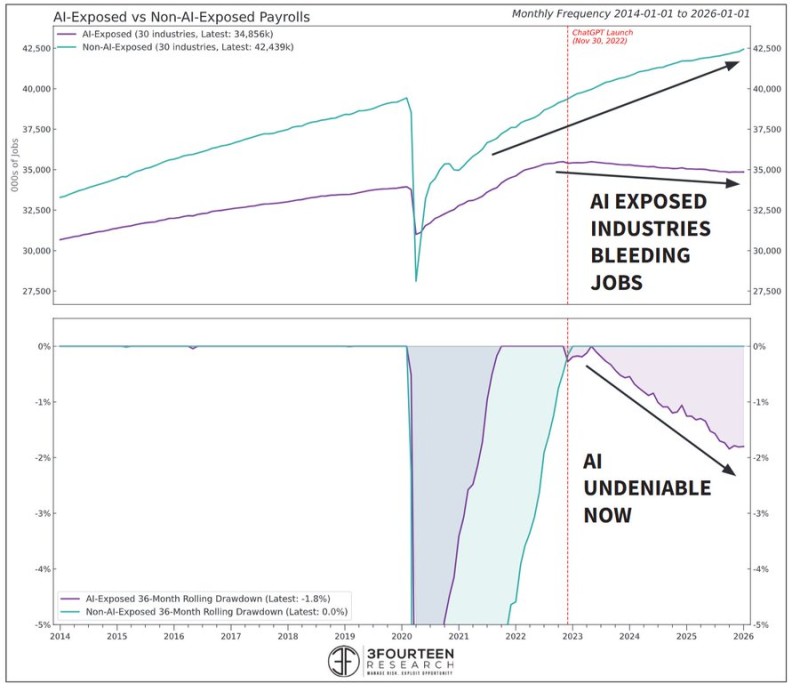
⬤ The upper panel shows payroll levels in AI-exposed industries have plateaued and are underperforming their prior growth trend, while non-AI-exposed industries keep expanding steadily. Recent figures put AI-exposed payrolls at roughly 34,856 thousand jobs versus about 42,439 thousand in non-AI-exposed sectors. Both categories took a hit during the 2020 pandemic, but their recovery paths went in different directions. Non-AI-exposed industries bounced back on a consistent upward path, while AI-exposed sectors show clear stagnation relative to where they were heading before.
⬤ The lower panel backs this up with a 36-month rolling drawdown metric. AI-exposed industries are currently running a negative drawdown of about -1.8%, meaning employment sits below its previous trend. Non-AI-exposed industries are basically flat at 0.0%. The widening gap between the two suggests automation and AI integration are increasingly shaping sector-level hiring patterns. Broader coverage, including Anthropics AI agents spark job automation fears across industries and ChatGPT Codex vs Claude Code 2 tools play completely different jobs, highlights ongoing debate around how AI systems are reshaping workforce dynamics across multiple roles.
⬤ This labor split carries real economic weight. Sustained underperformance in AI-exposed industries alongside continued expansion in AI-resistant sectors may impact productivity metrics, wage trends, and which sectors lead growth going forward. The growing payroll gap suggests technological displacement and structural labor shifts are becoming visible in official employment data.
 Usman Salis